Your metrics tell four different stories. Which one are you reading?
A practical framework for distinguishing reach, authority, demand and opportunity without turning every interaction into a commercial promise.

The graphic goes up and seems to deliver a response. There were more impressions, more reactions, or more visits than the week before. At the meeting someone concludes that the content is generating demand. Another person says the brand has already gained authority. A third person asks how many business opportunities have emerged. All three conversations use the same data to describe different results.
The problem isn't celebrating a favorable signal, it's asking you to prove something you can't prove on your own.
Reach, authority, demand and opportunity are not four names for success. They are distinct results, observable by different signals and separated by decisions that do not control a publication. Distinguishing them allows you to evaluate content more honestly, decide what to improve on, and avoid two opposing mistakes: dismissing a useful piece because it did not produce an immediate sale or declaring commercial success because it gained attention.
This framework does not propose a universal formula or an automated chain. It sets questions. Each organization must define its own signals, maintain context and contrast digital behavior with real conversations.
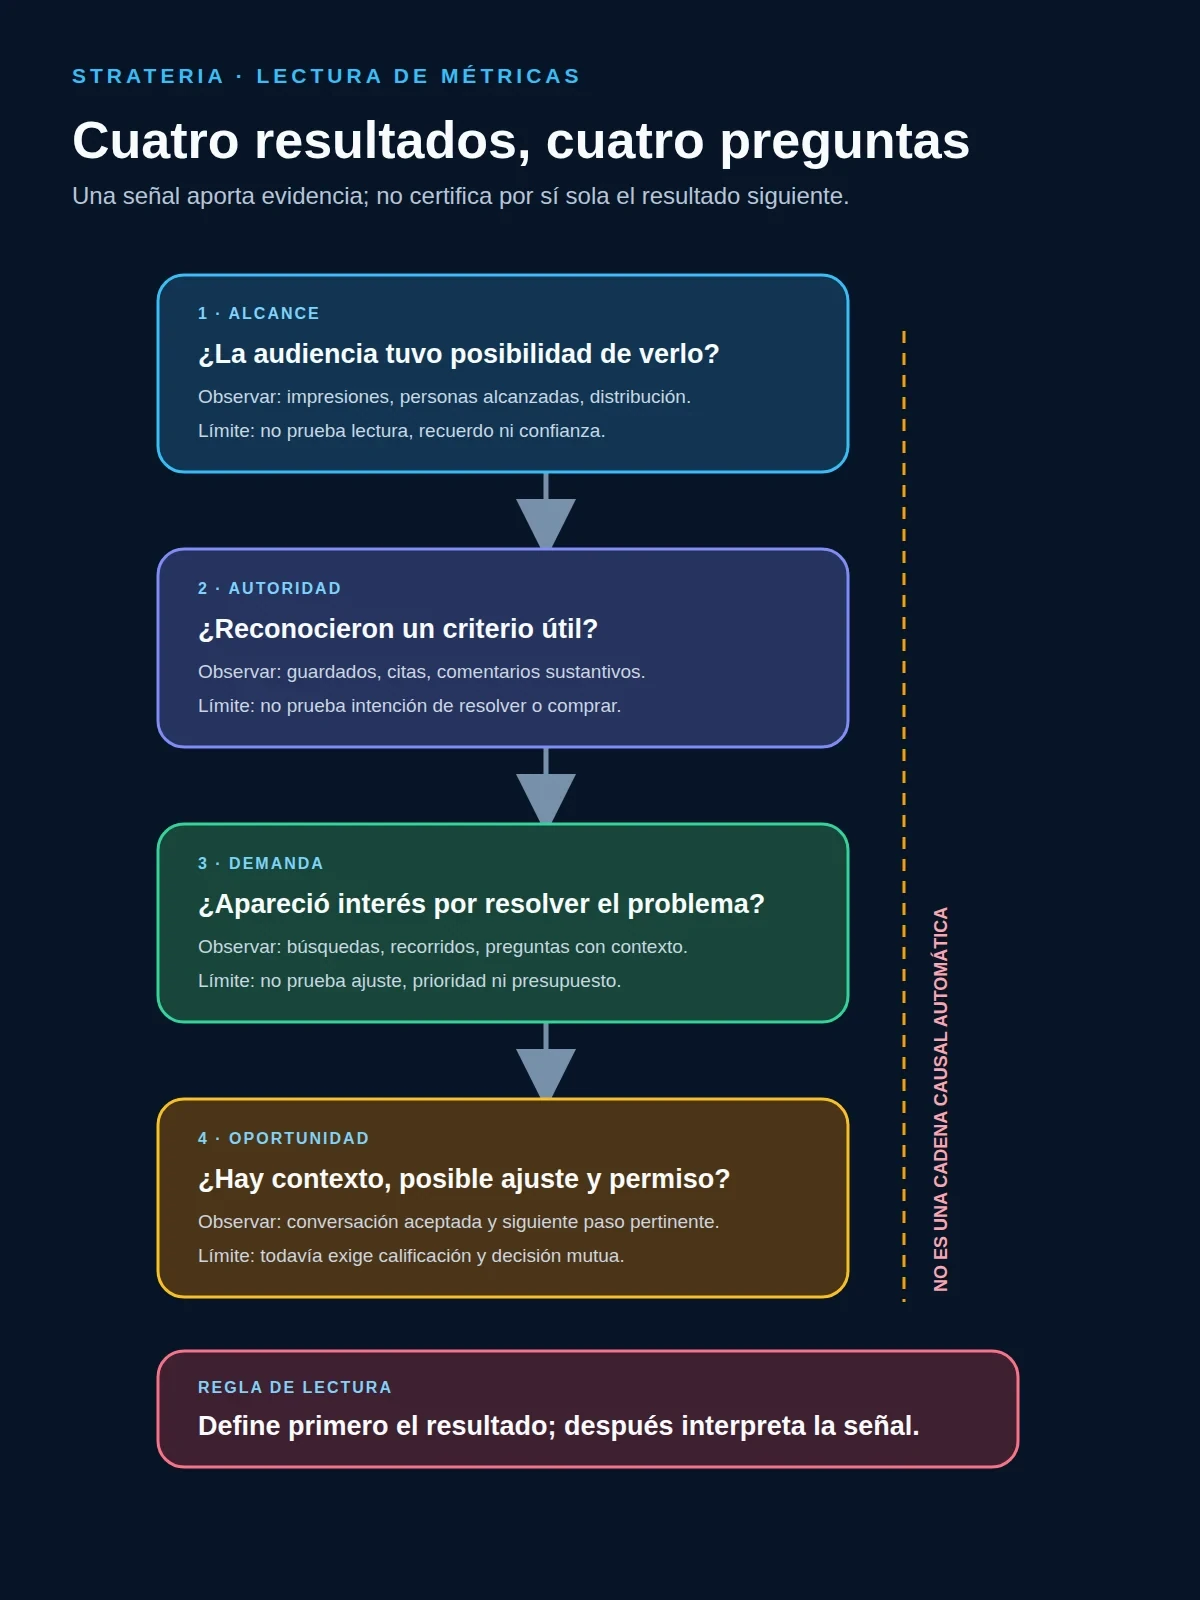
Figure 1. Each result answers a different question and no sign itself certifies the next result.
Source: self-published work from LinkedIn, Google Analytics, Lemon and Verhoef (2016) and Hanssens and Pauwels (2016).
1. Reach: the content was viewable
It answers questions such as: how many times was a piece shown, how many people it reached, what part of the intended audience had the chance to find it?
LinkedIn separates in its analytics metrics of content such as impressions, members reached, clicks, and interaction rate. That separation already contains a useful warning: just because a post appears on screen doesn't mean it's been read, understood, or considered for a decision.
Reach signals can include impressions, people reached, views or distribution between followers and non-followers, depending on what each platform offers. They serve to detect attention access issues: an idea may not have been distributed, the format may have limited its exposure or the available audience was small.
But reach does not tell, by itself, whether the right people received the message, nor does it prove memory, trust, purchase intent or sales intent. It is a condition of possibility: without exposure it is difficult for subsequent effects to occur, but exposure does not guarantee them.
The diagnostic question is simple: did the content reach the audience we wanted to confront this idea with? If you can't identify that audience, a high figure can be pleasant and unguiding.
2. Authority: content helps to recognise a criterion
Authority is more difficult to observe because it does not live in a single metric. It describes the recognition that a person or organization understands a problem, can explain it fundamentally, and offers useful criteria for decision making.
Content can circulate a lot because it entertains, simplifies a controversy, or matches a current conversation. That doesn't prove that the reader would trust their author to guide a complex decision.
Authority signals often need a combination and context: saved, shared accompanied by a recommendation, comments that develop the idea, recurring visits, spontaneous mentions, invitations to deepen or explicit references to the framework presented.
That's why it's worth adding qualitative evidence. What words does the audience use when responding? Does it repeat the core criterion or just react to the hook? Does the piece appear in later conversations? Does someone use it to explain a decision to another person?
The diagnostic question is, what evidence suggests that the reader recognized a criterion and not only saw a publication?
3. Demand: interest in solving a problem
Demand begins when attention is connected to a problem that a person or organization recognizes and considers relevant enough to explore an answer.
This does not mean that there is already an immediate purchase intention. A person can recognize the problem, seek information, compare approaches or try to solve it internally. Demand can be at an early stage. It can also exist before the content appears: the piece does not necessarily create it; it can help express it, orient it or make visible a need that was already present.
Signals can include clicks to a related article, searching for a solution, visits to service pages, relevant subscriptions, answers describing a particular situation, questions about the approach or consumption of various connected pieces.
Google Analytics models interaction through events and allows for recording relevant actions on a site. However, measuring an event does not solve its interpretation. A page visit, scroll, or click only makes sense when linked to a previous question and explicit definition.
The attribution documentation of Google Analytics recognizes that different models distribute credit between contact points differently. In a B2B decision, conversations, recommendations, searches, previous content and previous experience with the brand can intervene. Content is part of the journey; rarely explains it fully.
Lemon and Verhoef (2016) describe the customer experience as a journey composed of multiple touchpoints before, during, and after a decision.
The diagnostic question is, what did or said the person who shows interest in solving this problem, beyond interacting with the piece?
4. Opportunity: there is a possible next step with fit
An opportunity is not just any reader, follower or completed form, it is a situation in which there is enough context to evaluate a possible breakthrough between a need and a response that the organization can offer.
This context usually includes the problem, the person or organization involved, the timing, the constraints, the ability to act and an accepted next step.
A question such as 'do you work with distributed equipment?' can open up exploration; it does not yet confirm fit, decision-making authority, priority or budget. A detailed request also does not guarantee that the service is adequate.
Opportunity signals can be a contextual query, a diagnostic request, an accepted conversation, a relevant reference, or a record that meets defined criteria and allows for consensual follow-up. The definition must be agreed between those who produce content and those who manage business conversations.
The diagnostic question is: do we have enough context and permission to agree on a relevant next step? If either is missing, there may be demand, but not yet a qualifying opportunity.
It's not an automatic funnel.
Ordering the four categories can suggest a clear line: reach, then authority, then demand, and finally opportunity.
A private recommendation can open up an opportunity with little public reach. A person can acknowledge authority for months before expressing a need. A publication can capture existing demand without having built on its own previous confidence. Another can strengthen authority among current customers without seeking new opportunities.
That's why the framework works better as a map of results than a causal promise. Each piece must declare which function prioritizes and which signals would be reasonable.
An awareness post can seek relevant reach and recognition of the problem. An in-depth guide can strengthen authority and facilitate demand. An inquiry page can help turn existing interest into a conversation with context. Evaluating them with the same metric hides their purpose.
A simple matrix to check each piece
Before publishing, complete five fields:
1. Priority outcome: reach, authority, demand or opportunity. 2. Specific audience: who should recognise the situation. 3. Observable signal: which action or response would be consistent with the objective. 4. Limit of interpretation: what does not allow concluding that signal. 5. Next decision: what will you change if the signal appears or doesn't appear.
| Results | Careful Reading of Evidence |
|---|---|
| Reach | Observe exposure and distribution; do not conclude reading, memory or trust. |
| Authority | It combines qualitative and recurring signals; it doesn't turn popularity into a recognized criterion. |
| Requested | Seek an explicit interest in the problem; do not confuse interaction with business intention. |
| Opportunity | It requires context, possible fit, permission and next step; don't count any contact as an opportunity. |
The table does not replace a definition of each result itself. It serves to prevent a visible figure from doing four incompatible analytical work.
For example, an authority-oriented piece may prioritize that leaders in a sector keep the framework and mention it in substantive comments. The limit is clear: the keepers do not prove commercial intent. The subsequent decision could be to deepen the question that produced better conversations, not immediately launch an offer.
In another demand-oriented piece, the signal could be the step from the article to a related guide and a query describing the problem.
How to review a dashboard without confusing results
A useful dashboard doesn't start with all the available metrics. It starts with decisions.
Hanssens and Pauwels (2016) argue that demonstrating the value of marketing requires connecting metrics with results and business decisions, in addition to recognizing measurement and causality limits.
First, separate indicators by category. Then, keep the piece, audience, date, and source of each signal. Add qualitative notes on comments, questions, and conversations. Finally, review patterns in several pieces before declaring that an approach works.
It also avoids converting a temporal sequence into causation: that a query occurs after a publication does not prove that the publication produced it.
UTM parameters help identify the declared origin of a visit. Events help record actions. Conversations help understand motivations. No layer replaces the others.
The review may end with four separate sentences:
- Reach: who had a chance to encounter the idea.
- Authority: what evidence shows recognition of the criterion.
- Question: what behaviors or words reveal an interest in solving the problem.
- Opportunity: which cases have context, fit and a consensual next step.
If a sentence cannot be completed with evidence, the result remains as a hypothesis.
Conclusion: One metric shouldn't do four jobs
Metrics become dangerous when a visible signal replaces different questions. Reach matters, but it doesn't certify authority. Authority can exist without immediate demand. Demand doesn't automatically turn every interested person into an opportunity. And an opportunity needs context and qualification before it counts as a business outcome.
Separating these stories doesn't reduce the value of the content. It allows you to better recognize its contribution, design pieces with an explicit function, and learn without exaggerating.
In your next review, don't just ask if the publication worked, ask what result you were looking for, what signal appeared, what interpretation is allowed, and what decision changes thanks to that evidence.
From Metric to Decision
| Become a member of Strateria |
|---|
| If your reports still blend reach, authority, demand and opportunity, Strateria membership helps you organize a reviewable editorial process, connect each piece with a goal, and turn the evidence into better decisions without exaggerating what the data allows you to conclude. |
| Register with one click: https://strateria.app/register · Free access · No card. |
References
LinkedIn. Content analytics for your LinkedIn Page. https://www.linkedin.com/help/linkedin/answer/a547077
Google Analytics. About events. https://support.google.com/analytics/answer/9322688
Google Analytics. Get started with attribution. https://support.google.com/analytics/answer/10597962
Lemon, K. N., & Verhoef, P. C. (2016). Understanding Customer Experience Throughout the Customer Journey. Journal of Marketing, 80(6), 69–96. https://doi.org/10.1509/jm.15.0420
Hanssens, D. M., & Pauwels, K. H. (2016). Demonstrating the Value of Marketing. Journal of Marketing, 80(6), 173–190. https://doi.org/10.1509/jm.15.0417
Para profundizar en las fricciones entre experiencia y demanda, revisa https://strateria.app/en/blog/experiencia-demanda-cuatro-fricciones.